As cybersecurity professionals, one of the key challenges we often face is the sheer volume of log data we need to analyze. Whether we’re hunting for anomalies, investigating security incidents, or just keeping an eye on our network’s health, efficiently processing log data is important. I recently had the opportunity to further explore Splunk Data Administration, specifically the Parsing Phase and Data Preview—two areas that fundamentally shape how Splunk processes incoming data and prepares it for analysis. In this post, I’ll share what I learned and how these skills relate to my daily work.
Understanding the Flow of Data in Splunk
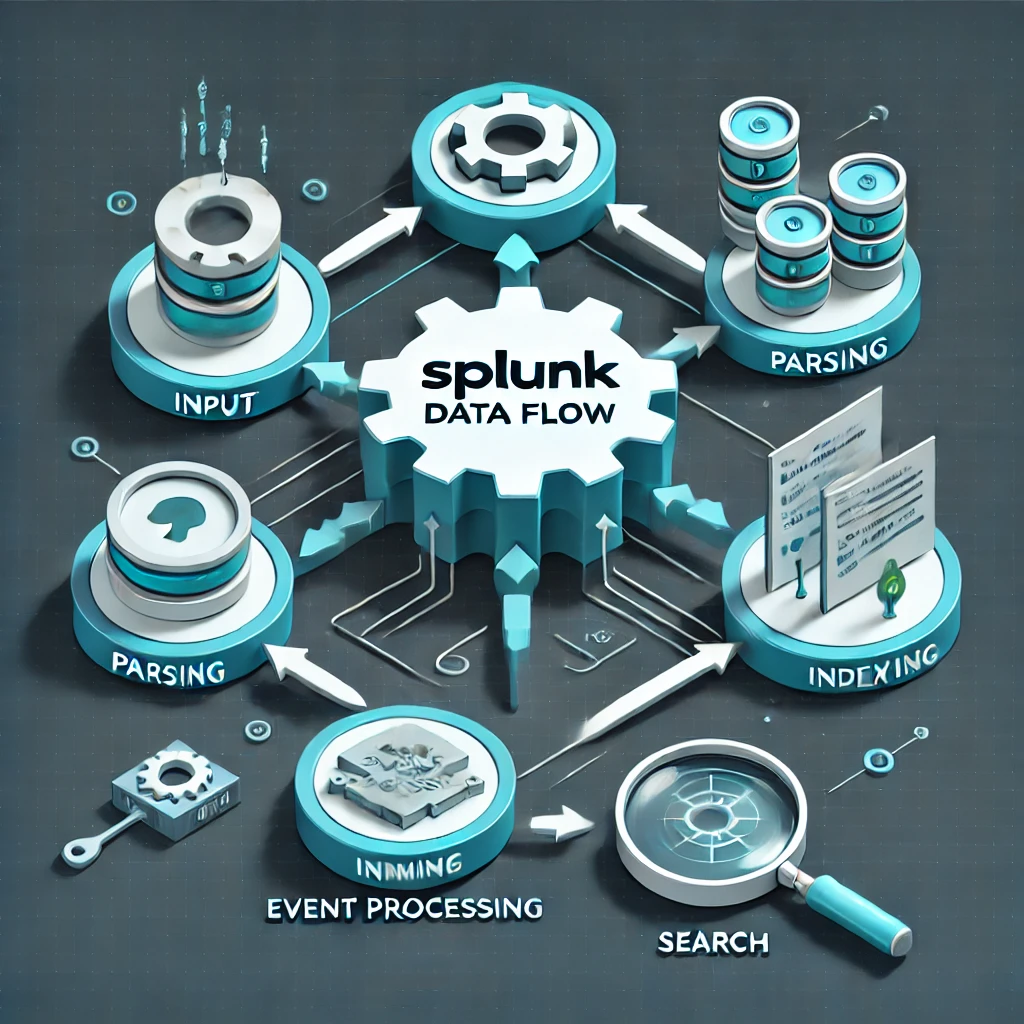
Splunk handles massive amounts of data from various sources—whether it’s logs from systems, network data, or even scripts. Understanding how data flows through Splunk is key to ensuring it is properly processed and indexed for analysis. Here’s a quick breakdown of the overall data flow:
- Input Stage – Data is ingested from log files, network devices, scripts, or forwarders and prepared for further processing.
- Parsing (Event Processing) Stage – This is where Splunk breaks incoming data into events, extracts timestamps, and applies configurations like regular expressions (regex) for line breaking and data masking. These steps are essential for structuring unorganized data and making it useful for analysis.
- Indexing Stage – After parsing, the structured events are written to disk and indexed, making them ready for future searches.
- Search Stage – Once indexed, data becomes available for searching, reporting, and alerting through the Splunk search head.
In this article, I’ll be focusing on the Parsing Stage, where I worked on event line breaking, time extraction, and masking sensitive PII data to make logs more structured and easier to analyze, especially logs from sources like Web Application Firewalls (WAF).
You may reference official Splunk documentation for more details about managing event processing on Splunk.
Tackling Event Line Breaking
One of the most valuable aspects of the session was learning how to configure event line breaking in Splunk, a skill that’s essential when dealing with unstructured data. At work, I often have to analyze Web Application Firewall (WAF) logs, and let me tell you, those logs can be a nightmare. WAF logs are usually unstructured and often look like a wall of text, which we jokingly refer to as “log vomit.”
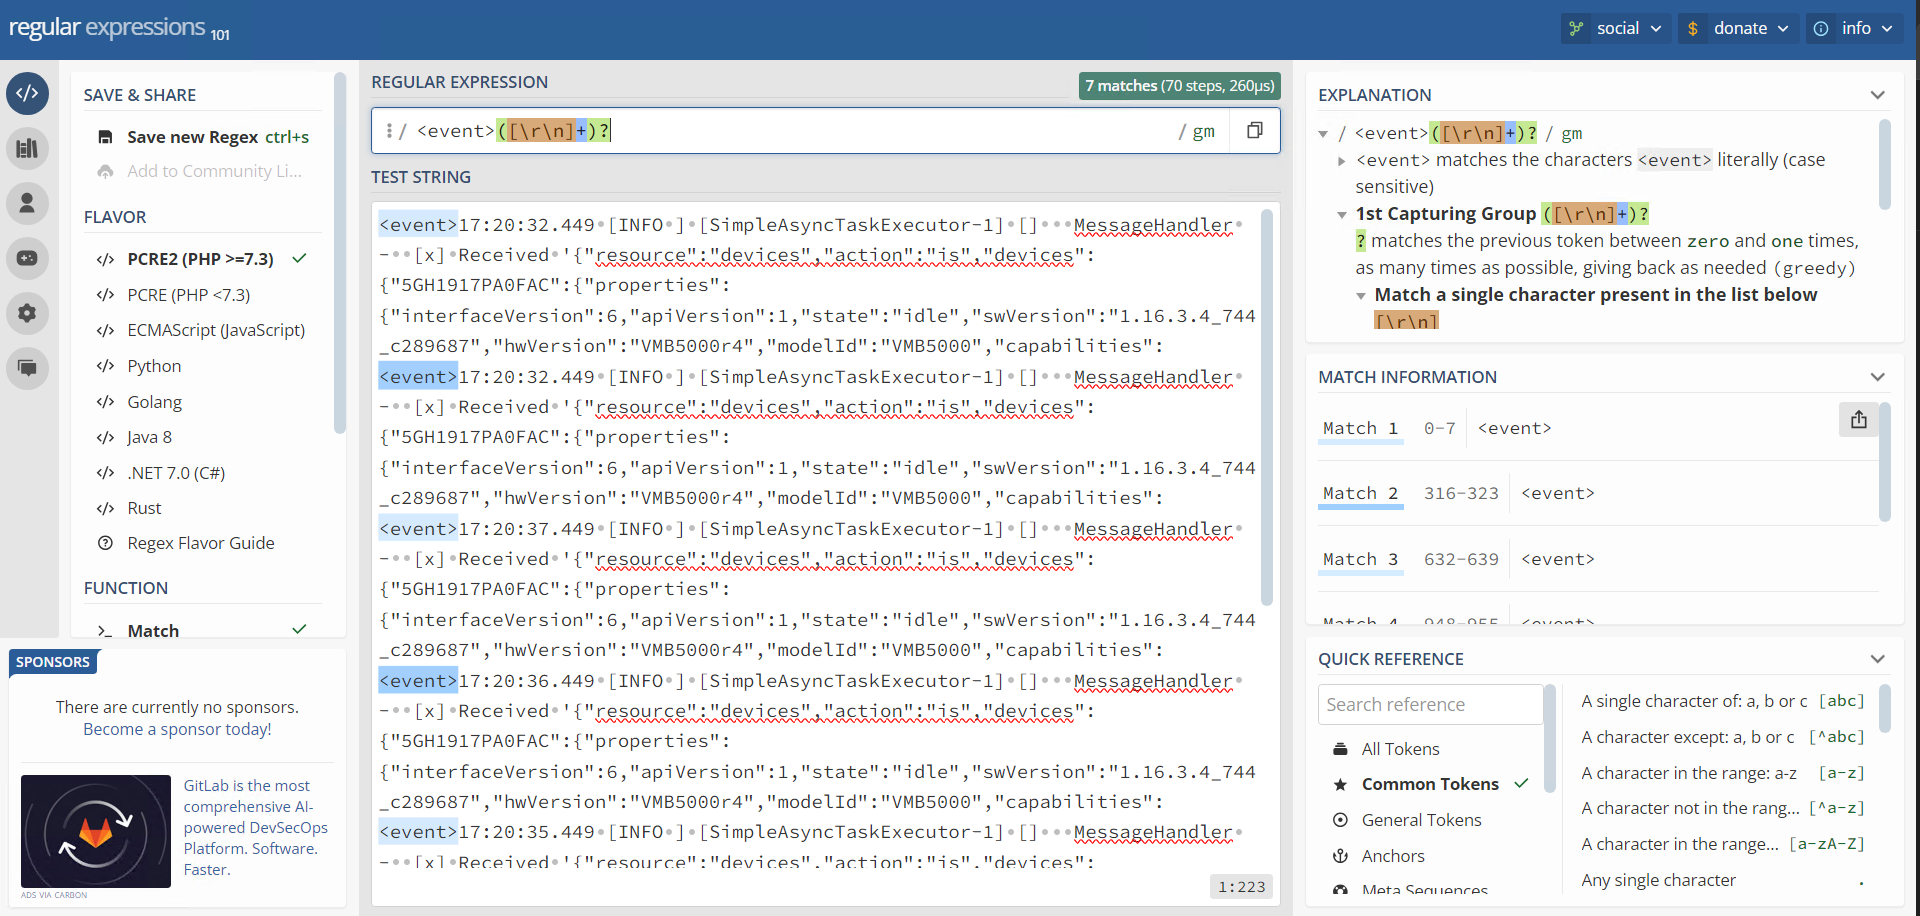
To help me create the right regex patterns for breaking these logs into structured events, I used regex101.com, an online regex editor. This tool was invaluable in allowing me to test my regular expressions in real-time and ensure they would correctly match the patterns in the logs.
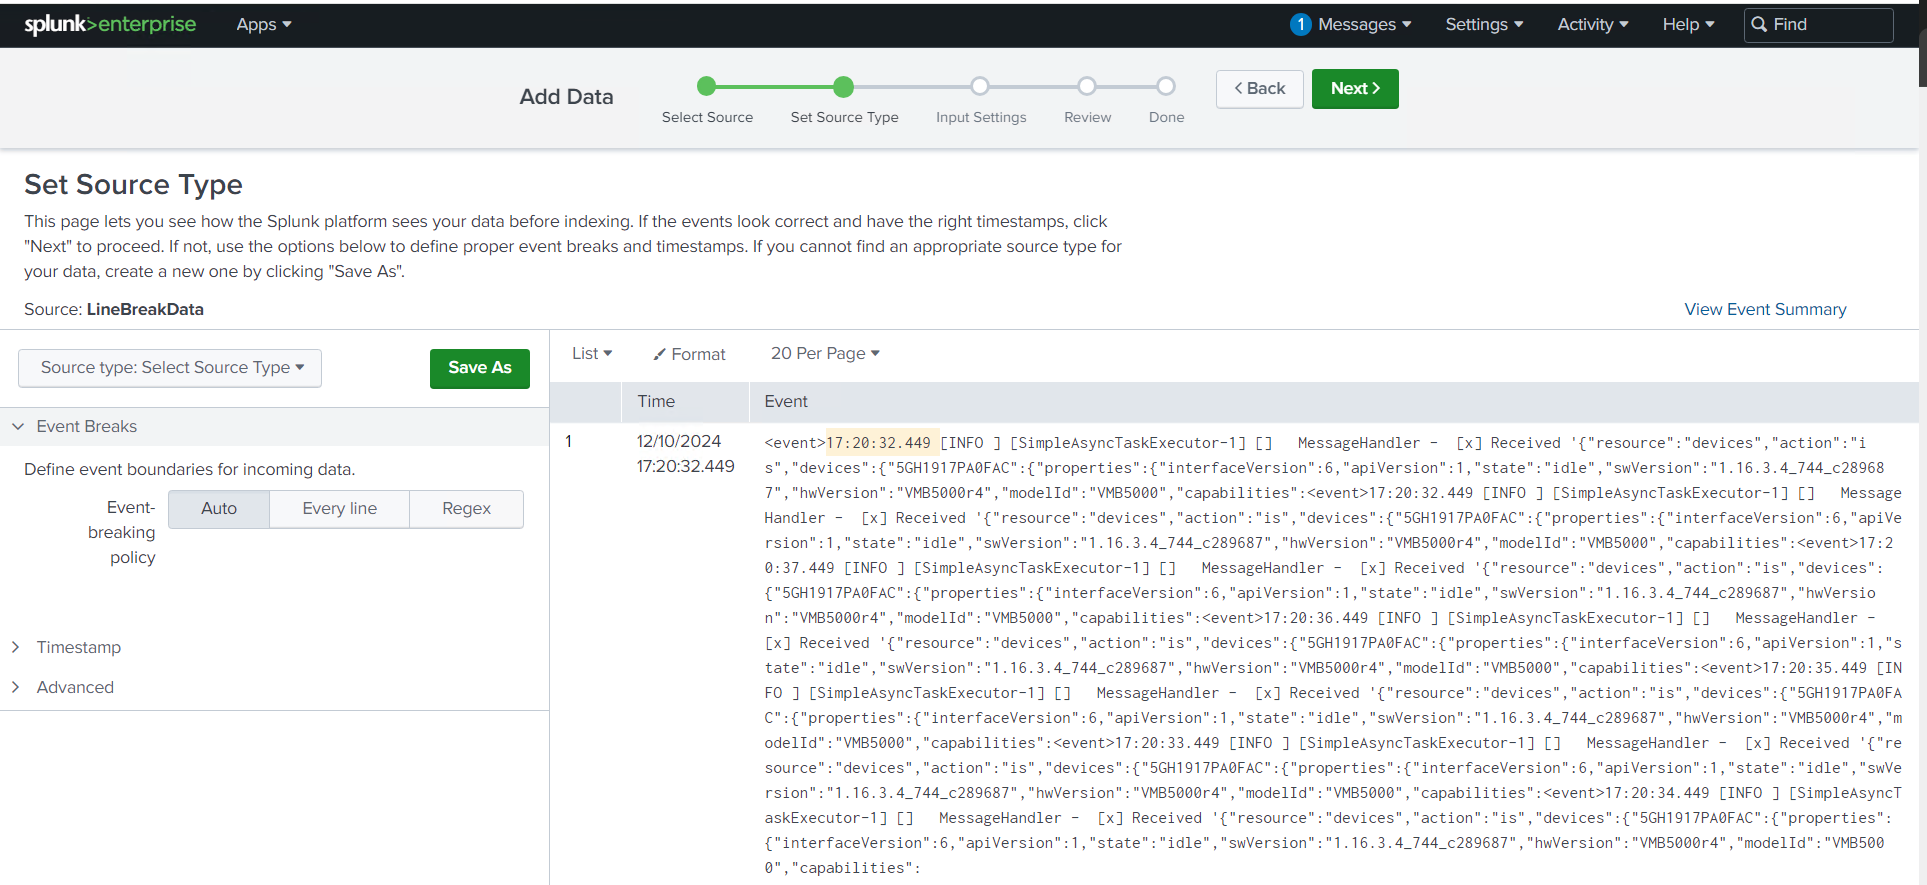
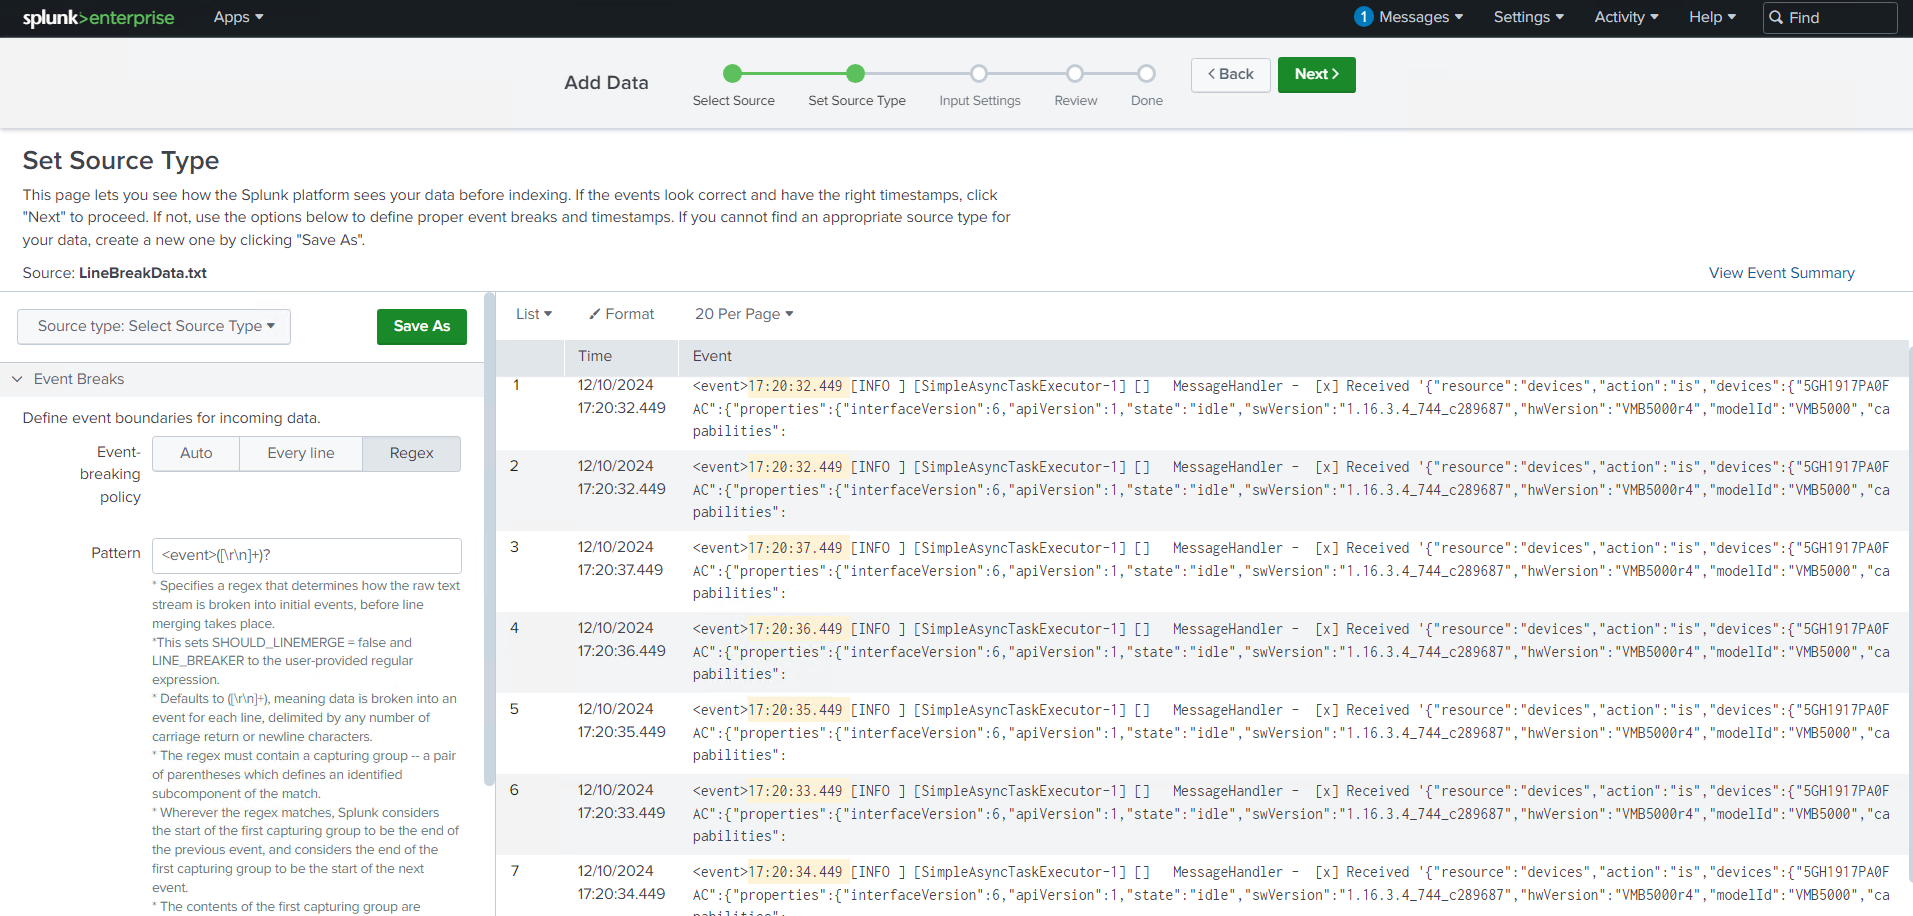
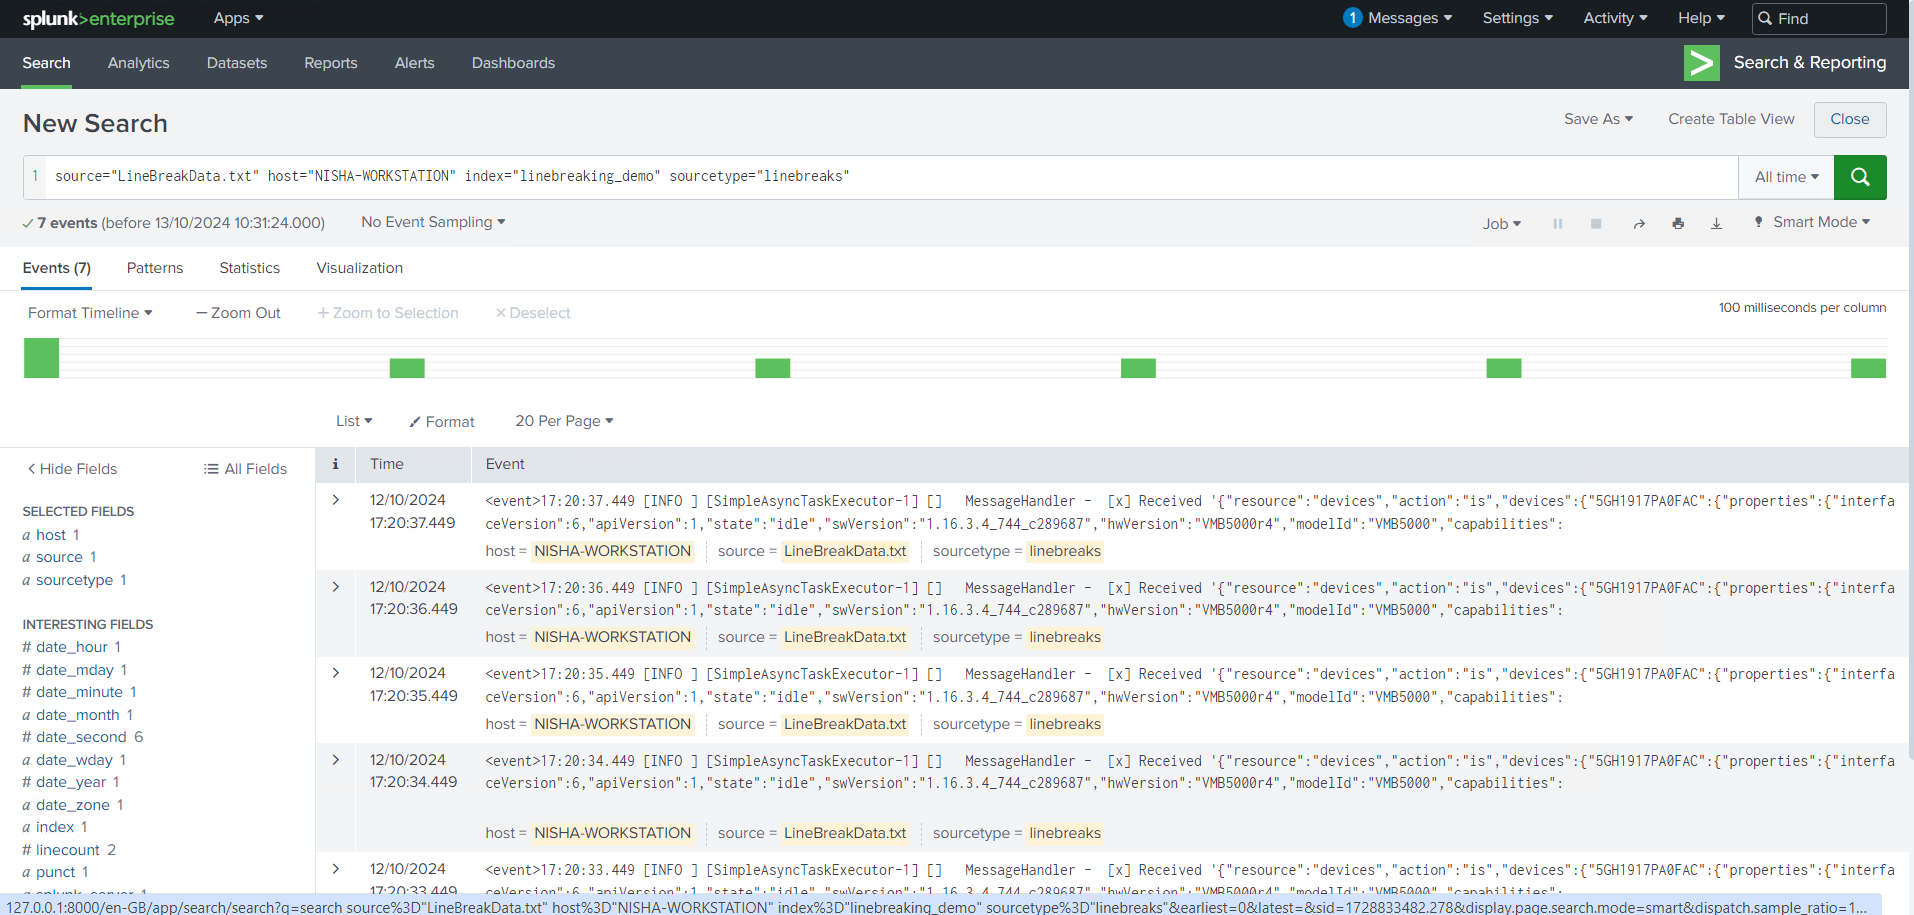
By applying the regular expressions (regex) I developed, I was able to identify event boundaries in the logs, split them into individual events, and make the data far more readable. In this case, I worked with JSON logs, using regex to match each event tag and successfully split the logs into structured events.
Here’s an example of how I used regex101 to fine-tune my regex patterns:
<event>([\r\n]+)?
This skill has been directly applicable to my daily work. By teaching Splunk how to interpret the chaotic structure of WAF logs, I’ve significantly reduced the time it takes to analyze them.
Time Extraction Made Simple
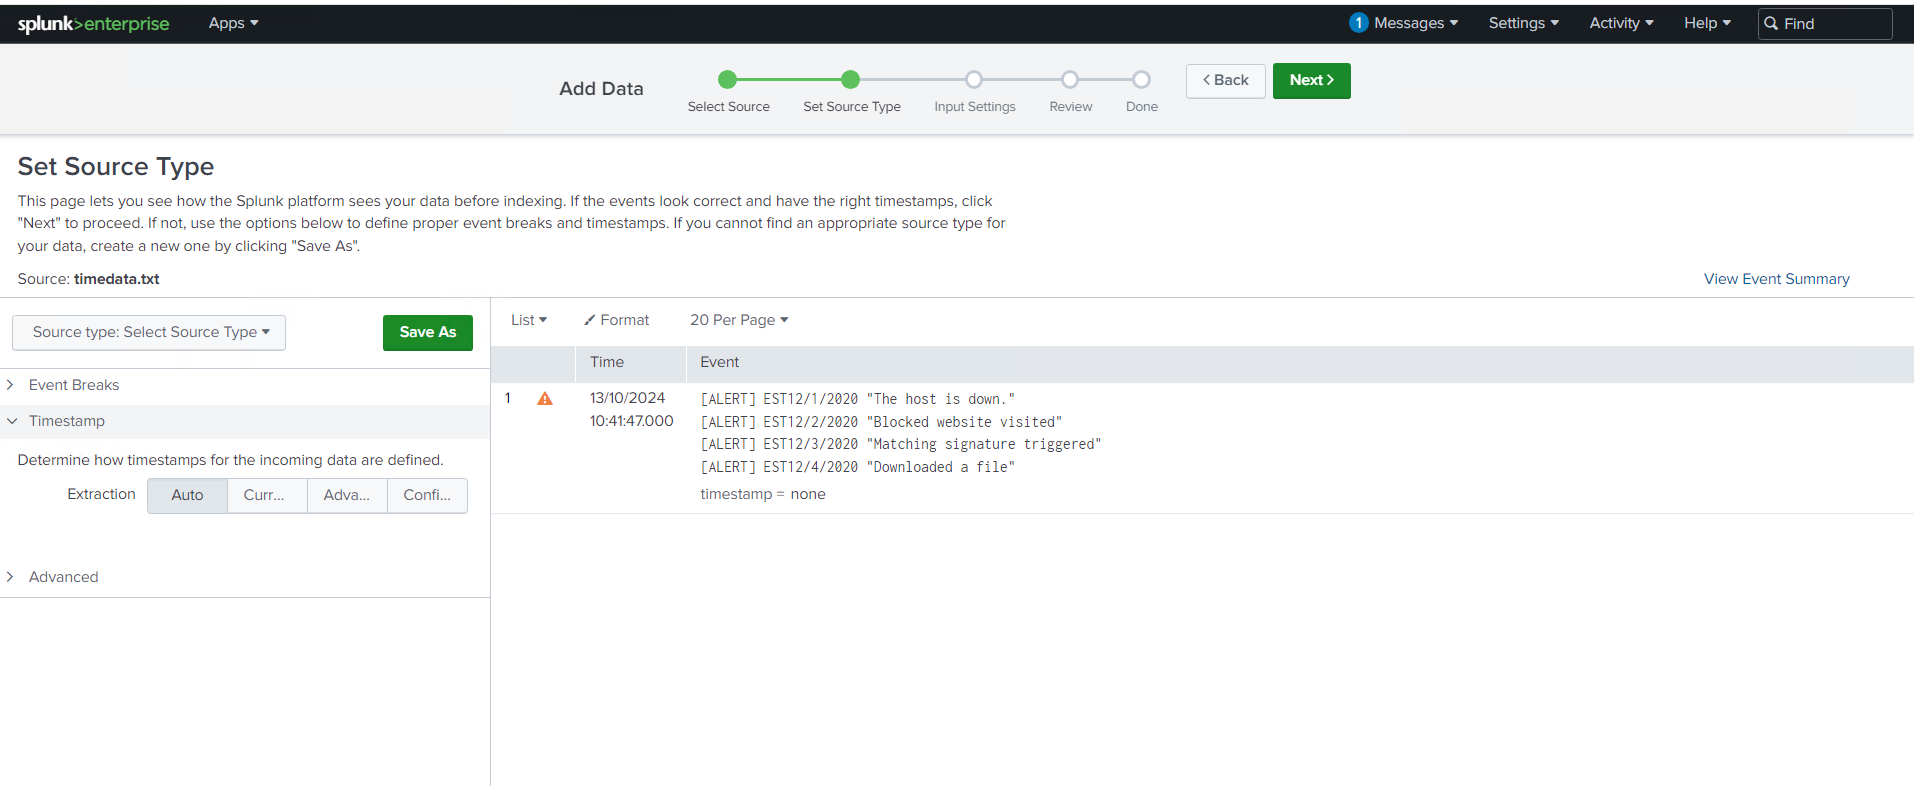
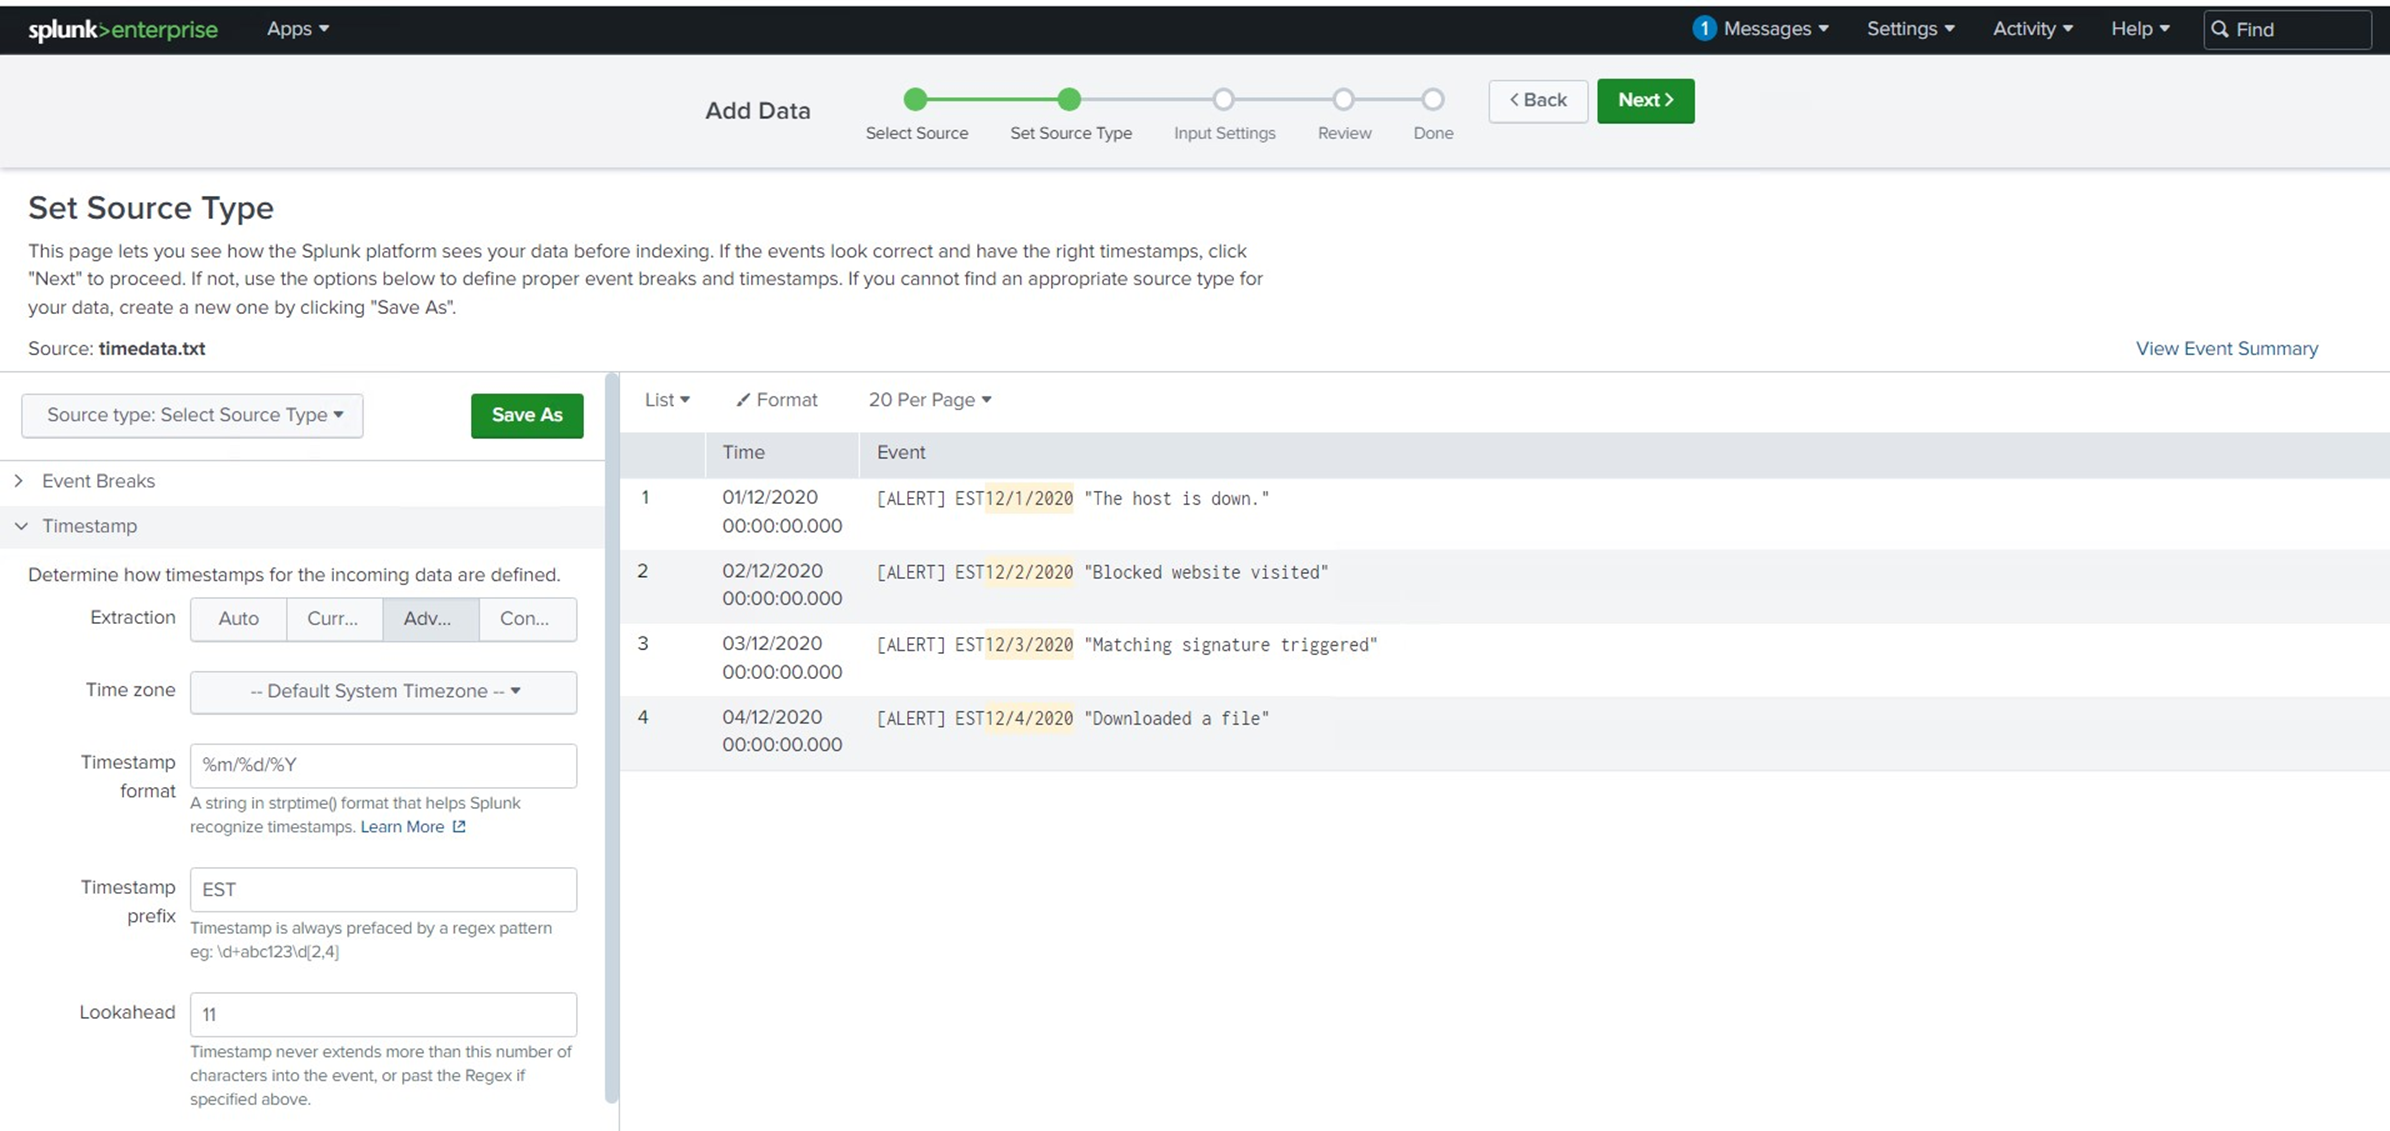
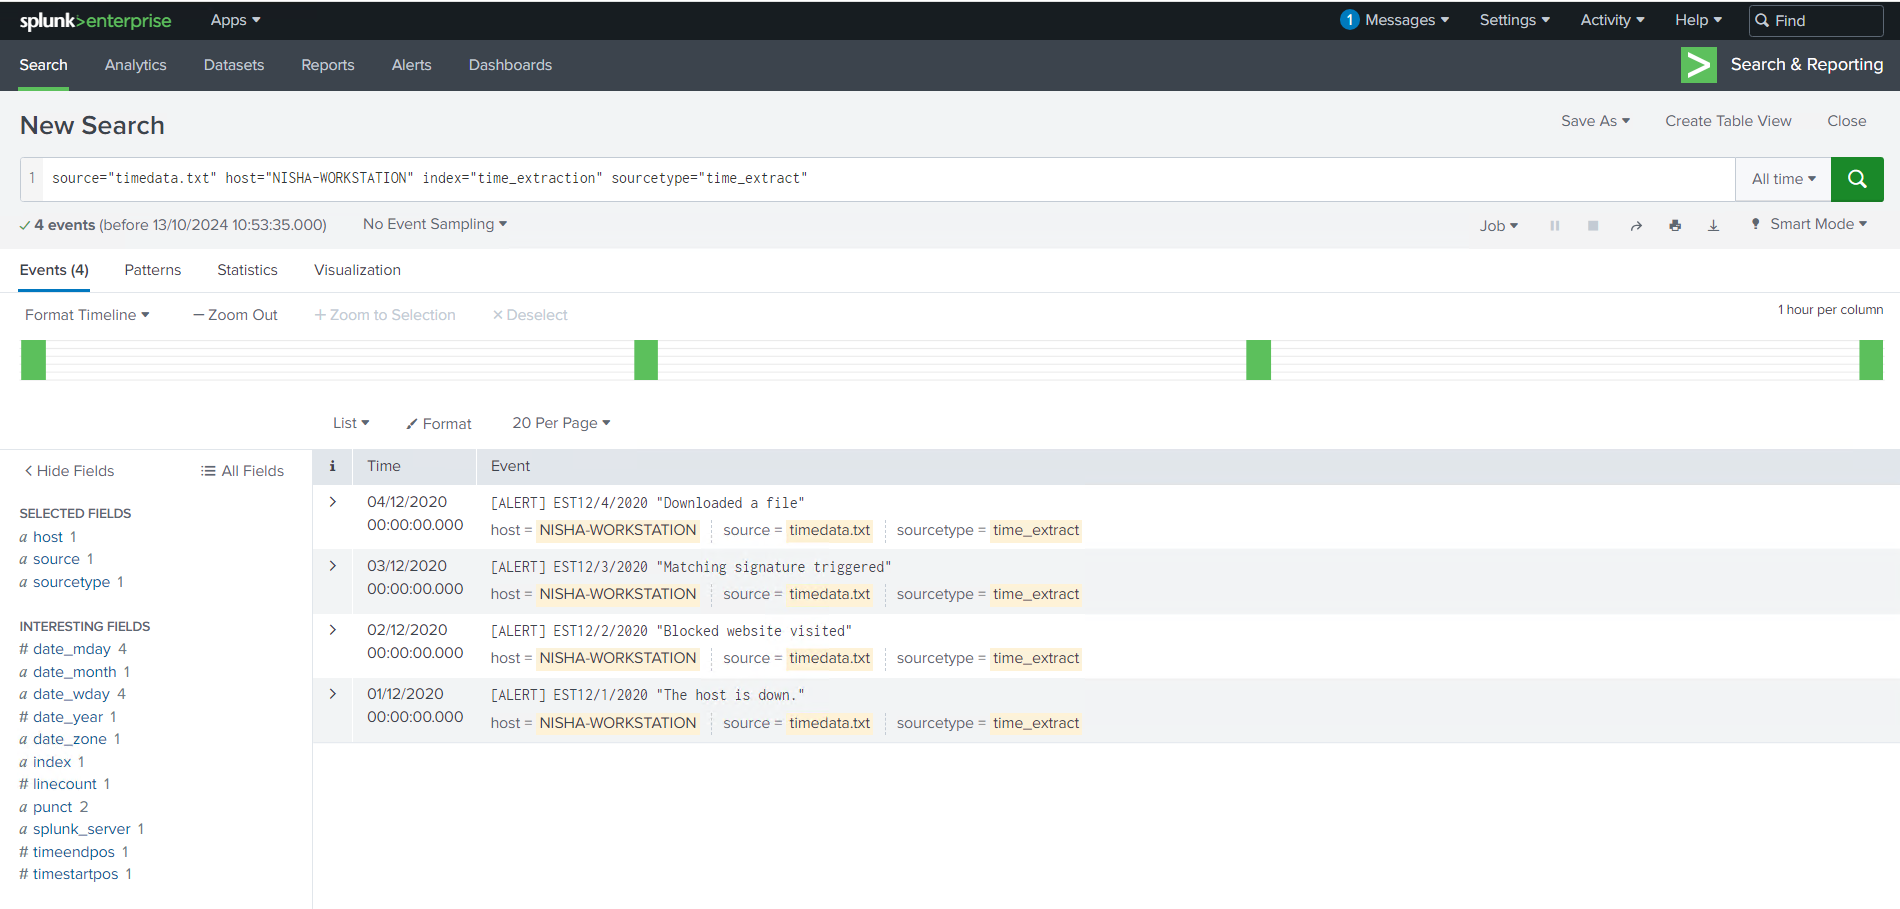
Another challenge that came up during the session was the issue of time extraction. In some cases, multiple alerting events get grouped together in a single log file, which makes it difficult to pinpoint when each event occurred. I learned how to handle this by using a timestamp prefix and a regex lookahead to identify and extract the exact timestamp from each event.
In this particular scenario, a strptime() format of %m/%d/%Y was used, which allowed Splunk to accurately interpret the timestamps in the logs. By configuring Splunk to recognize these patterns, I was able to separate events with precision and ensure the timeline was correct, improving the quality of my log analysis.
Masking PII for Data Privacy
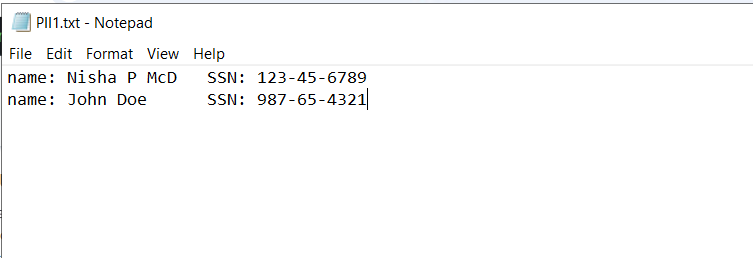
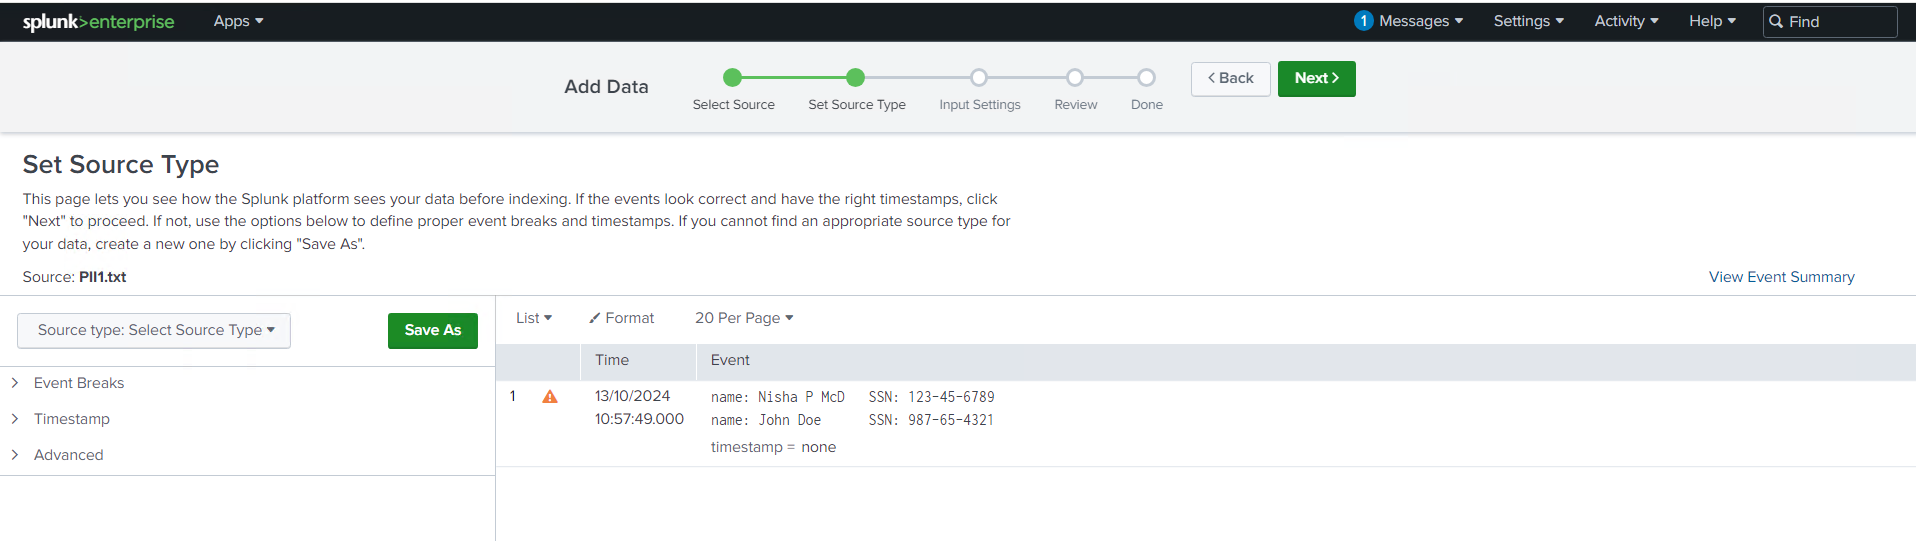
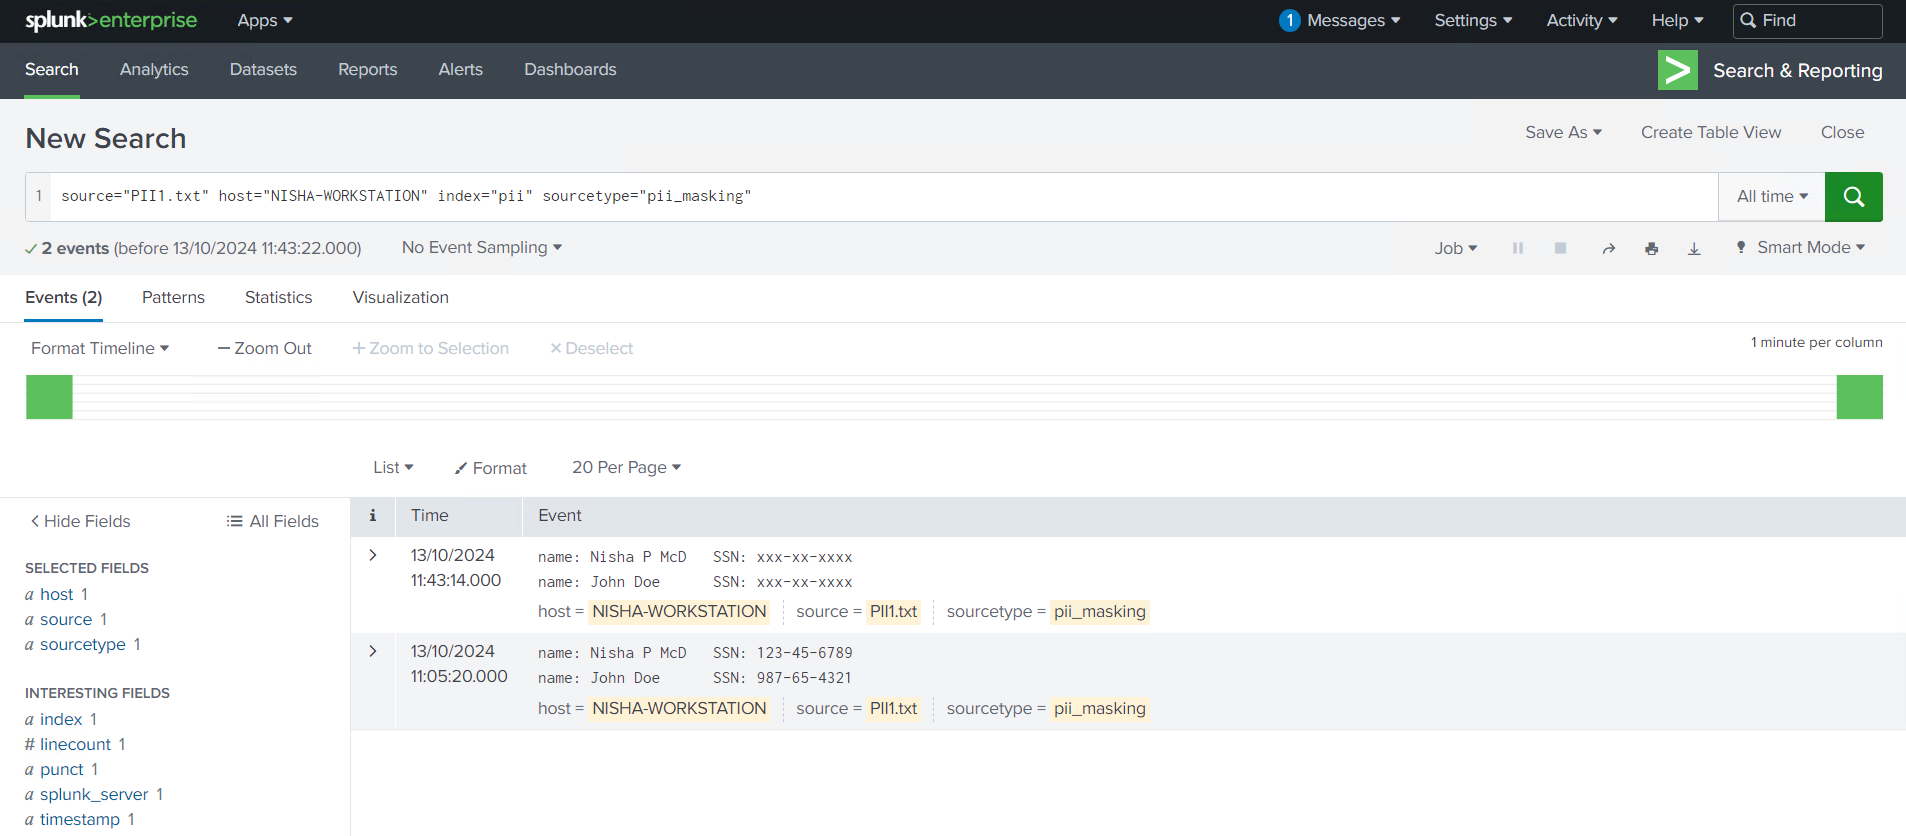
As security professionals, protecting sensitive information is always top of mind, especially when dealing with Personally Identifiable Information (PII). In this session, I worked with logs that contained Social Security Numbers, which is highly sensitive data that should be masked to prevent exposure.
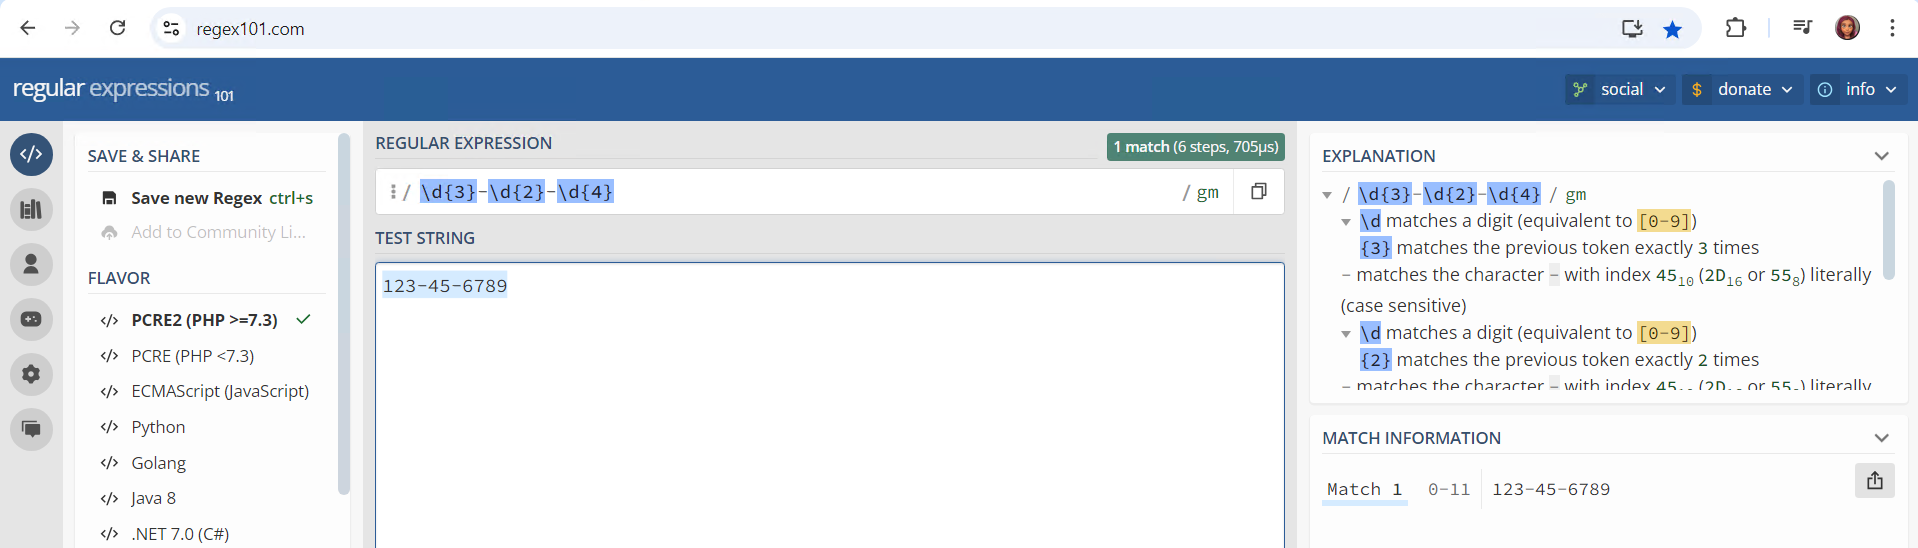
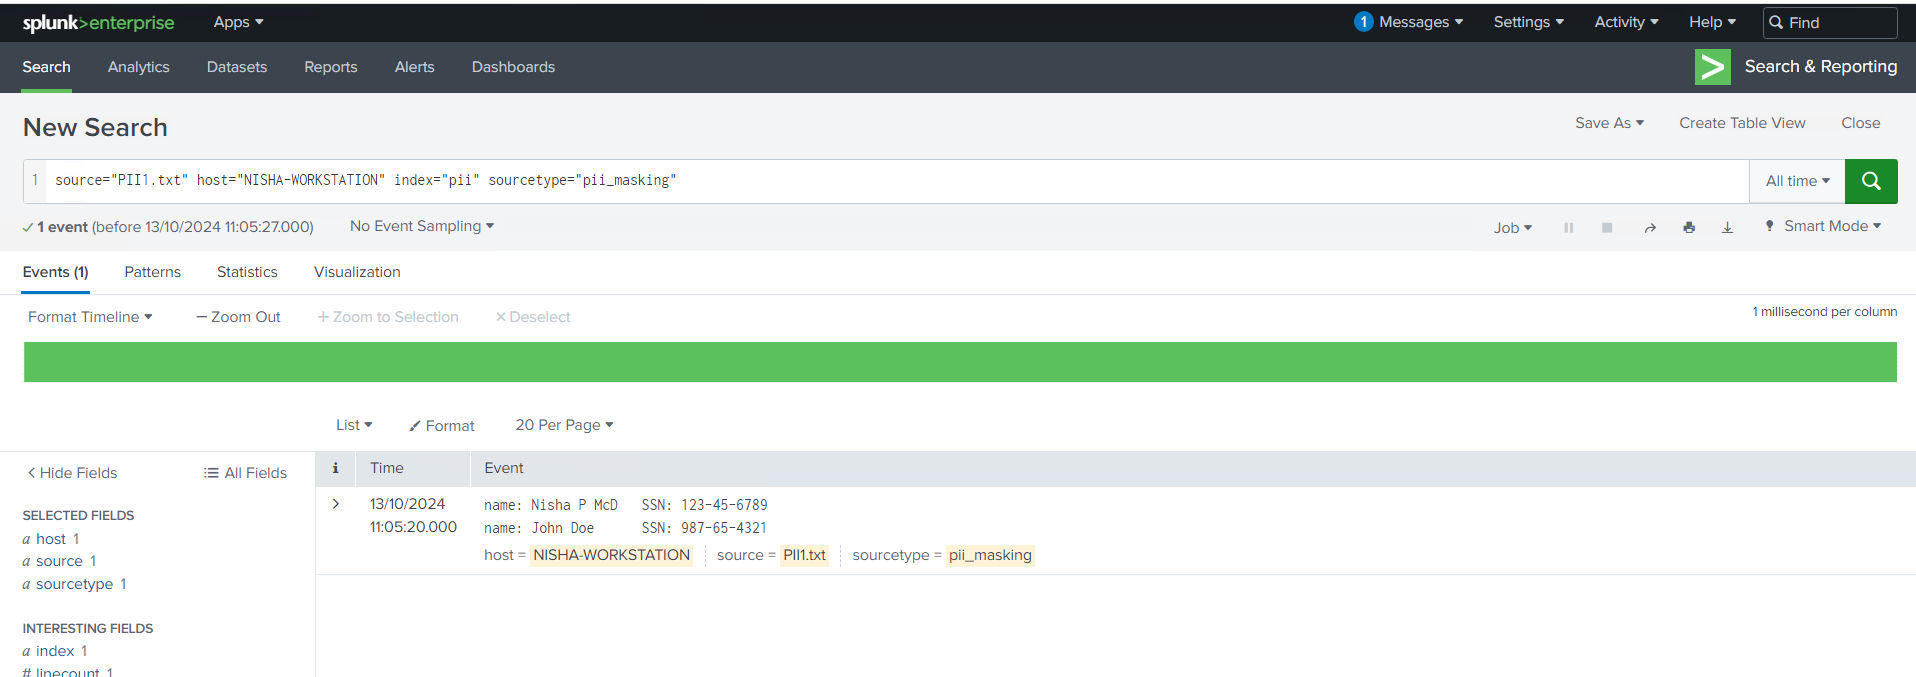
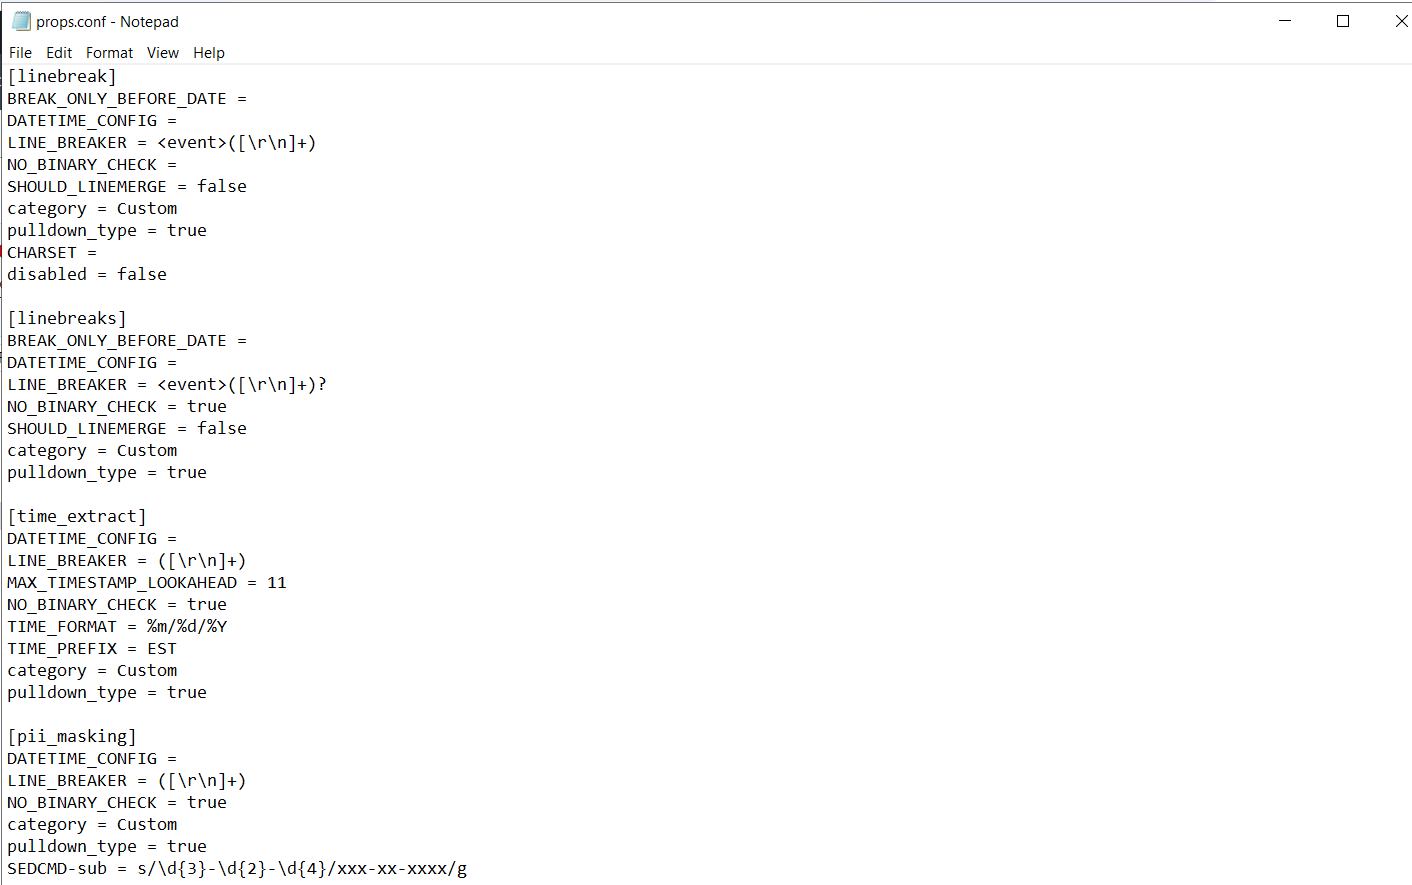
Using a regex pattern and updating the props.conf file, I configured Splunk to automatically mask PII in incoming data. The regular expression in sed mode I used, | rex mode=sed "s/\d{3}-\d{2}-\d{4}/xxx-xx-xxxx/g", allowed me to replace the Social Security Numbers with a masked format across all events. This is an essential technique for ensuring compliance with data privacy regulations like GDPR or HIPAA.
s/\d{3}-\d{2}-\d{4}/xxx-xx-xxxx/g
Introducing the Magic 6 in props.conf
During the session, I also learned about the Magic 6—a set of six key settings in Splunk’s props.conf file that control how incoming data is processed. Mastering these settings is essential for configuring how Splunk breaks events, extracts timestamps, and structures data for analysis. Here’s a brief overview:
- SHOULD_LINEMERGE – Determines whether Splunk should merge multiple lines into a single event.
- LINE_BREAKER – Defines the pattern for identifying the start of a new event.
- TIME_PREFIX – Specifies the pattern that precedes the timestamp in the log.
- TIME_FORMAT – Defines the format of the timestamp (e.g.,
%m/%d/%Y). - MAX_TIMESTAMP_LOOKAHEAD – Specifies how far Splunk should look to find a timestamp.
- TRUNCATE – Limits the number of characters Splunk reads from an event.
In addition to the Magic 6, there’s also the Magic 8, which includes two more settings: DATETIME_CONFIG and BREAK_ONLY_BEFORE. These are helpful when dealing with more complex log structures, such as multi-line events.
Applying These Skills in Real-World Scenarios
The skills I learned in this hands-on session have already had a direct impact on how I handle logs in my day-to-day work. WAF logs that once took me hours to analyze can now be broken down and structured in minutes, and I’m better equipped to protect sensitive data like PII. Additionally, understanding the Magic 6 in the props.conf file has improved my ability to fine-tune how Splunk processes and organizes incoming data.
If you’re looking to optimize your Splunk Data Administration skills, I highly recommend diving into the Parsing Phase, focusing on event line breaking, time extraction, and working with the props.conf file. These skills are not only useful for analyzing complex logs but also for ensuring data privacy and compliance.
Stay tuned for more hands-on insights!
In my future posts, I’ll be sharing even more tips and techniques to improve your Splunk data analysis and threat detection workflows.