
Room Link: https://tryhackme.com/r/room/walkinganapplication
In the "Walking An Application" room on TryHackMe, you will learn how to manually assess a web application for security vulnerabilities using only the built-in tools available in your web browser. Automated security tools and scripts often miss many potential vulnerabilities and valuable information. This room emphasizes the importance of manual review to identify and understand these overlooked issues.
Learning Objectives
In this room, you will use the following built-in browser tools to uncover and analyze security issues:
- View Source: Learn to view the human-readable source code of a website directly through your browser.
- Inspector: Understand how to inspect and modify page elements to access content that is typically restricted.
- Debugger: Explore how to inspect and control the flow of a page's JavaScript to uncover hidden functionalities and vulnerabilities.
- Network: Monitor all network requests made by a page to identify potential security issues and data exposures.
By mastering these tools, you will be equipped to conduct a thorough and effective manual review of web applications, enhancing your ability to find and address security vulnerabilities that automated tools might miss.
Task 1 - Walking An Application
Use either the in-browser attackbox or your own device over VPN to connect to the URL provided for your machine.
Task 2 - Exploring The Website
As a penetration tester, one of your primary responsibilities is to identify features within a website or web application that could be vulnerable to exploitation. These typically include interactive elements that engage with the user.
Identifying these interactive parts can range from easily spotting a login form to thoroughly examining the website's JavaScript. A good starting point is to use your browser to explore the website, taking notes on each page, area, and feature, and summarizing your findings.
Conducting a comprehensive site review is essential as it ensures that all components and functionalities that might be susceptible to attacks are identified. By meticulously documenting your observations, you can guarantee that no significant areas are missed, allowing for a complete assessment of the site's security.
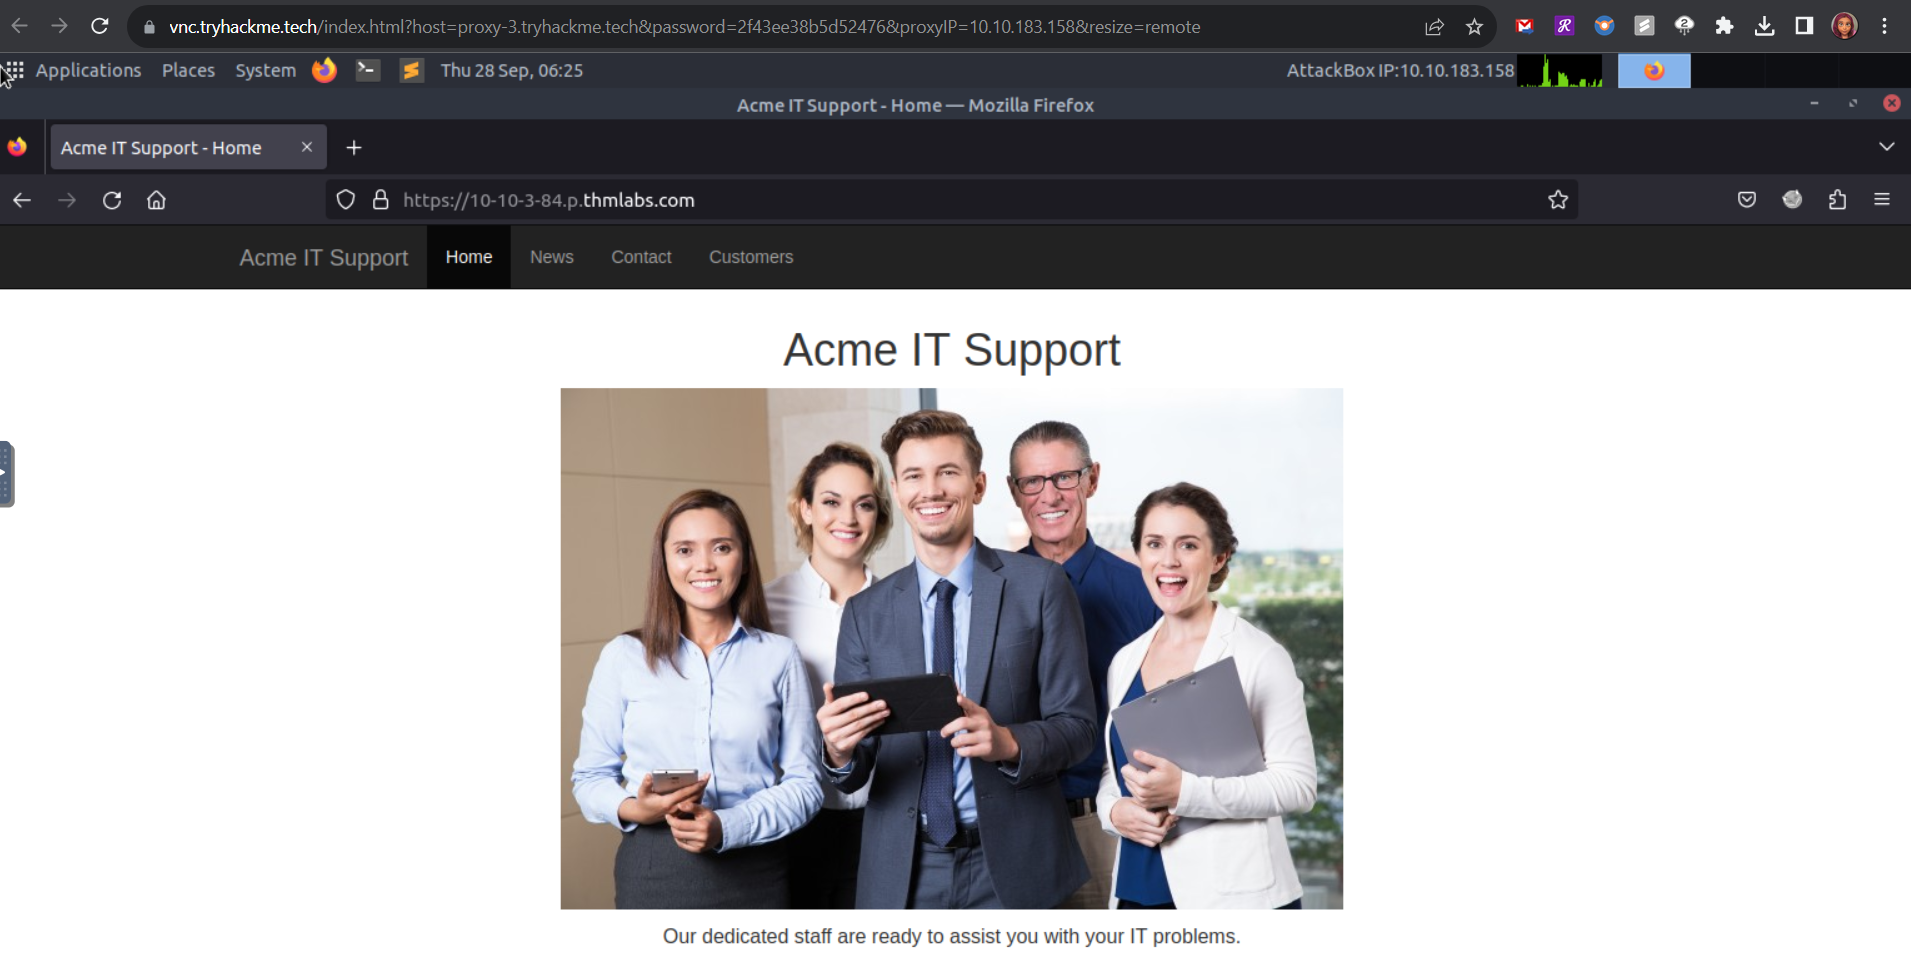
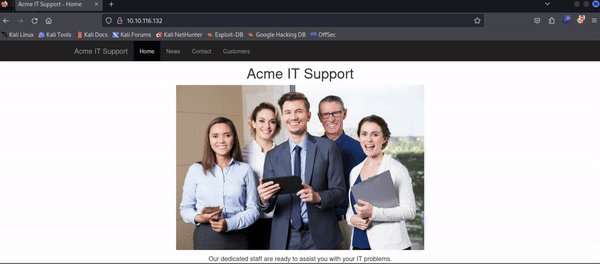
Here's an example of a site review for the Acme IT Support website:
- Home Page: Provides an overview of services, with no interactive elements.
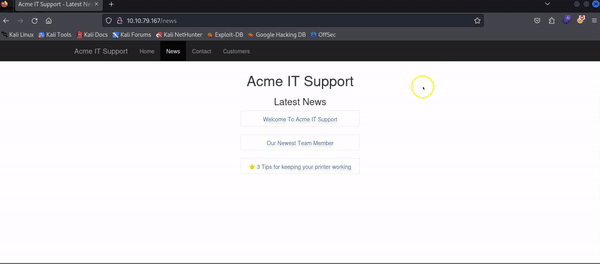
- News Page: Features the latest news at Acme IT Support.
- Contact Page: Includes a form for submitting contact information.
- Customer Support Portal: Requires user login, offering various support resources.
Performing a detailed site review sets the stage for a thorough and effective penetration test, ensuring that all potential vulnerabilities are identified and examined.
Task 3 - Viewing The Page Source
The page source is the human-readable code returned to our browser from the web server each time we make a request. This code comprises HTML (HyperText Markup Language), CSS (Cascading Style Sheets), and JavaScript, which collectively dictate the content, layout, and interactivity of the webpage.
Viewing the page source can reveal important information about the web application. It helps in identifying hidden content, comments left by developers, and potential vulnerabilities.
How to View the Page Source
- Right-click on the webpage and select View Page Source from the context menu.
- Alternatively, you can prepend
view-source:to the URL in the browser’s address bar (e.g.,view-source:https://www.google.com/). - Most browsers also have an option to view the page source within the menu, often located under Developer Tools or More Tools.
Let's View Some Page Source!
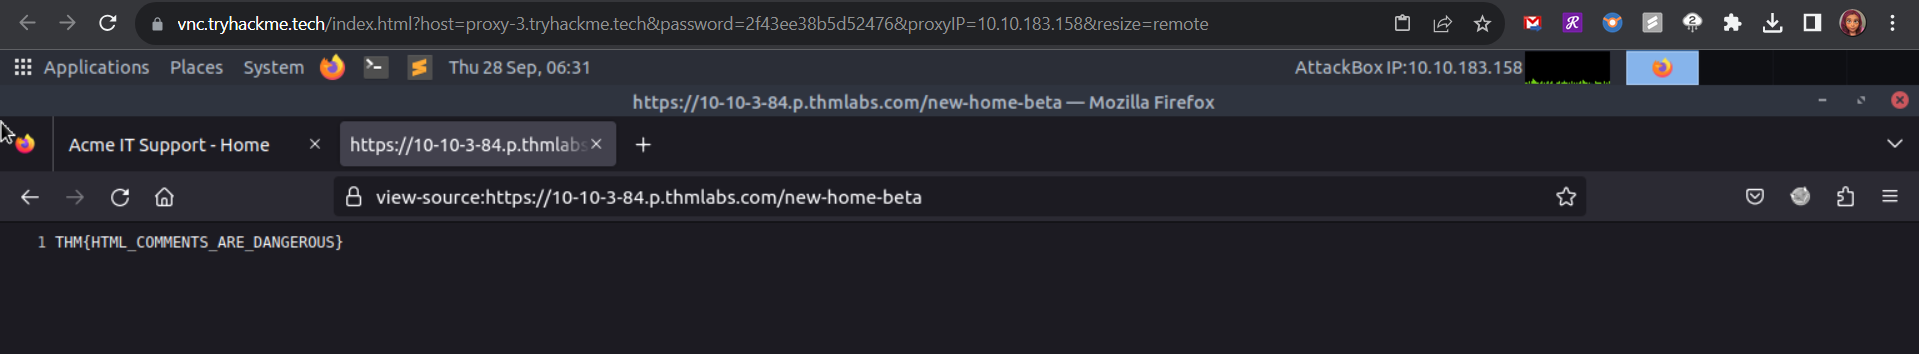
Try viewing the page source of the Acme IT Support website’s homepage. While a complete explanation of the code is beyond the scope of this room, we can highlight critical elements:
- Comments: Look for code sections starting with
<!--and ending with-->. These are developer comments that can provide insights or notes. For example, a comment may indicate that the homepage is temporary while a new one is under development. Follow any links in the comments to find your first flag. - Anchor Tags: Links to different pages are written in anchor tags (
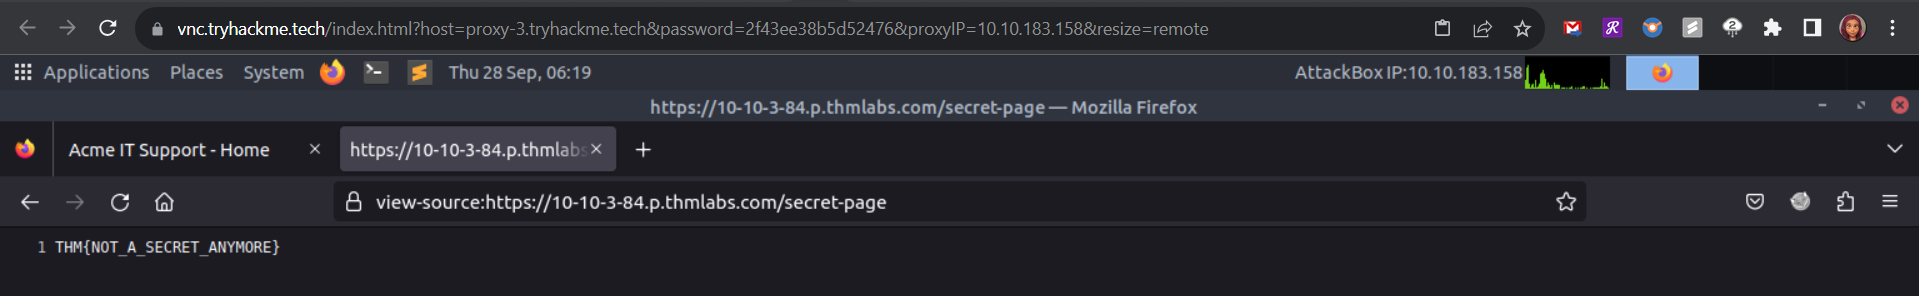
<a>) with the URL specified in thehrefattribute. For instance, the contact page link might be found on line 31. - Hidden Links: Further down the page source, you may find hidden links starting with "secr". Viewing these links might reveal private areas used for storing sensitive information. In this room, these links lead to flags.
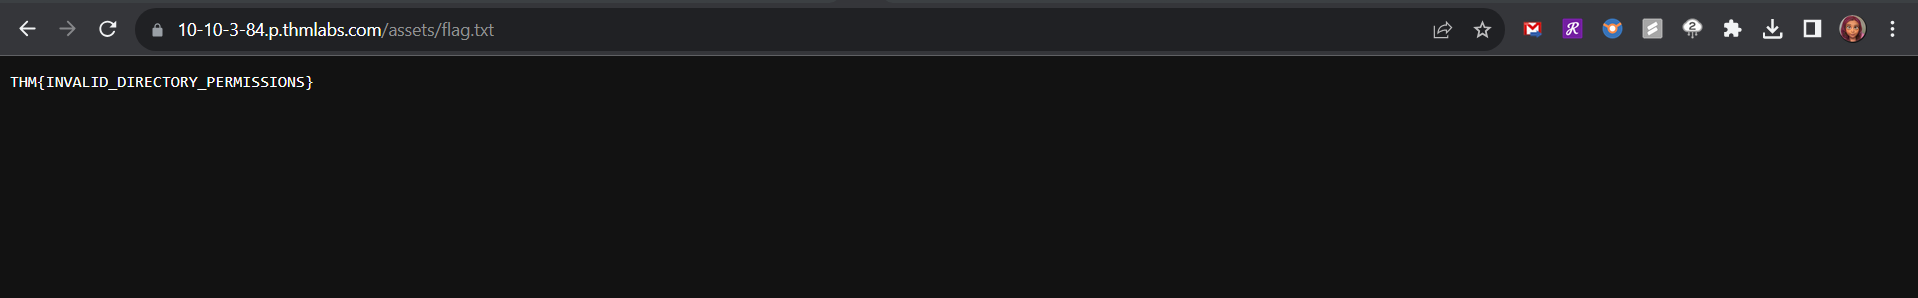
- External Files: CSS, JavaScript, and images can be included via HTML. Sometimes, directory listing is enabled by mistake, revealing all files in a directory. This can expose confidential information like backup files or source code. Check the directories for misconfigurations and find the
flag.txtfile.
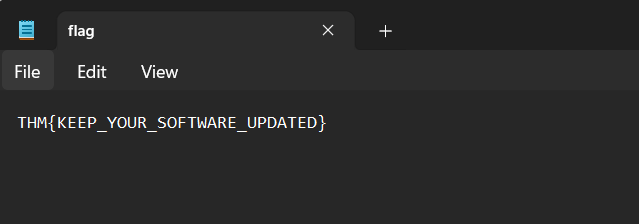
Websites often use frameworks—prebuilt code collections for common features like blogs, user management, and form processing. Viewing the page source can indicate if a framework is in use and its version. Knowing the framework and version can help identify known vulnerabilities. For example, a comment at the bottom of the page might indicate the framework and version, along with a link to the framework's website. Reviewing this information can lead you to another flag by identifying if the framework is outdated. Right-click on the page and select "View page source" Visit the page that is referenced in the page comment to retrieve the flag.
Q: What is the flag from the HTML comment?Answer: THM{HTML_COMMENTS_ARE_DANGEROUS}
Q: What is the flag from the secret link?
Answer: THM{NOT_A_SECRET_ANYMORE}
Q: What is the directory listing flag?
Answer: THM{INVALID_DIRECTORY_PERMISSIONS}
Q: What is the framework flag?
Answer: THM{KEEP_YOUR_SOFTWARE_UPDATED}
Task 4 - Developer Tools - Inspector
Every modern browser includes developer tools; this is a tool kit used to aid web developers in debugging web applications and gives you a peek under the hood of a website to see what is going on. As a pentester, we can leverage these tools to provide us with a much better understanding of the web application. We're specifically focusing on three features of the developer tool kit, Inspector, Debugger and Network.
Opening Developer ToolsThe way to access developer tools is different for every browser. The example below is demonstrated on a Firefox browser:
Inspector
The page source does not always reflect the current state of a webpage, as CSS, JavaScript, and user interactions can alter its content and style. To see what is being displayed in the browser at any given moment, we use the Element Inspector. This tool provides a live view of the webpage as it appears currently.
In addition to viewing this live representation, we can edit and interact with the page elements. This functionality is particularly useful for web developers to troubleshoot and debug issues.
On the Acme IT Support website, navigate to the news section, where you will find three news articles.
The first two articles are readable, but the third has been blocked with a floating notice above the content stating you have to be a premium customer to view the article. These floating boxes blocking the page contents are often referred to as paywalls as they put up a metaphorical wall in front of the content you wish to see until you pay.
Right-clicking on the premium notice ( paywall ), you should be able to select the Inspect option from the menu, which opens the developer tools either on the bottom or right-hand side depending on your browser or preferences. You'll now see the elements/HTML that make up the website.
Locate the DIV element with the class premium-customer-blocker and click on it. You'll see all the CSS styles in the styles box that apply to this element, such as margin-top: 60px and text-align: center. The style we're interested in is the display: block. If you click on the word block, you can type a value of your own choice. Try typing none, and this will make the box disappear, revealing the content underneath it and a flag. If the element didn't have a display field, you could click below the last style and add in your own. Have a play with the element inspector, and you'll see you can change any of the information on the website, including the content. Remember this is only edited on your browser window, and when you press refresh, everything will be back to normal.
Q: What is the flag behind the paywall?
Answer: THM{NOT_SO_HIDDEN}
Task 5 - Developer Tools - Debugger
The Debugger panel in developer tools is primarily designed for debugging JavaScript, making it a valuable resource for web developers trying to identify issues in their code. For penetration testers, it offers the capability to delve into the JavaScript code. In Firefox and Safari, this tool is named Debugger, while in Google Chrome, it's referred to as Sources.
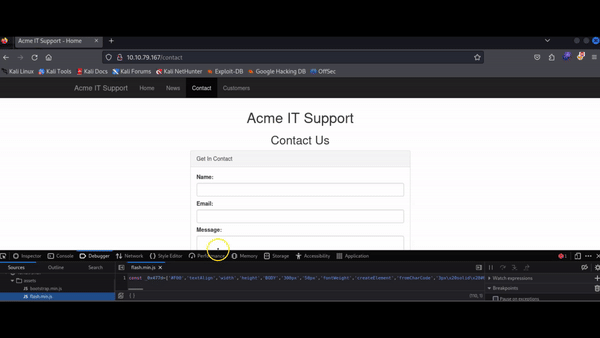
On the Acme IT Support website, navigate to the contact page. Each time the page loads, you might observe a quick red flash on the screen. We will use the Debugger to investigate this red flash and determine if it contains any interesting information. Although debugging a red dot is not a typical task for a penetration tester, it helps us familiarize ourselves with the Debugger's functionality.
In both browsers, you'll find a list of all resources used by the current webpage on the left-hand side. By navigating to the assets folder, you will find a file named flash.min.js. Clicking on this file will display its JavaScript content.
Often, JavaScript files are minified, meaning all formatting (tabs, spaces, and newlines) is removed to reduce the file size. This file is no different and is also obfuscated, making it deliberately hard to read to prevent easy copying by other developers.
We can partially restore the formatting using the "Pretty Print" option, represented by two braces { }, to make the code somewhat more readable. However, due to the obfuscation, it may still be challenging to understand. By scrolling to the bottom of the flash.min.js file, you will find the line: flash['remove']();
Q: What is the flag in the red box?
Answer: THM{CATCH_ME_IF_YOU_CAN}
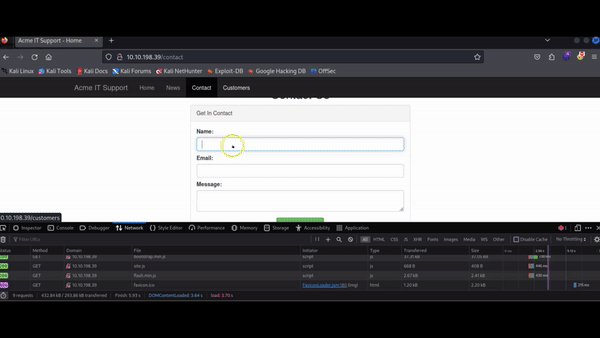
Task 6 - Developer Tools - Network
The Network tab in developer tools is useful for monitoring every external request made by a webpage. By clicking on the Network tab and refreshing the page, you can view all the files the page is requesting.
Try this on the contact page. If the list becomes too cluttered, you can use the trash can icon to clear it.
With the Network tab open, fill out the contact form and click the Send Message button. You will see an event appear in the Network tab. This event represents the form submission happening in the background via AJAX. AJAX allows web applications to send and receive data in the background without reloading the current page.
Q: What is the flag shown on the contact-msg network request?
Answer: THM{GOT_AJAX_FLAG}